If your company is trying to lower its carbon footprint, the carbon black you use might be a bigger factor than you think. Carbon black is a key ingredient in tires, rubber products, plastics, and inks. But how it’s made makes a huge difference to your sustainability numbers.
This article breaks down the real life cycle assessment (LCA) data comparing recovered carbon black (rCB) to virgin carbon black (vCB), in plain language, so you can understand what these numbers mean for your business or your research.
What Is Carbon Black, and Why Does Its Source Matter?
Carbon black is a fine black powder used to reinforce rubber, add color to plastics and inks, and provide UV protection in many products. Traditionally, it’s made through a furnace process that burns petroleum products like oil and natural gas at very high temperatures, typically between 1,200°C and 1,900°C. This process uses a large amount of energy and creates sulfur and nitrogen oxide emissions, which is part of why it has come under increasing environmental scrutiny.
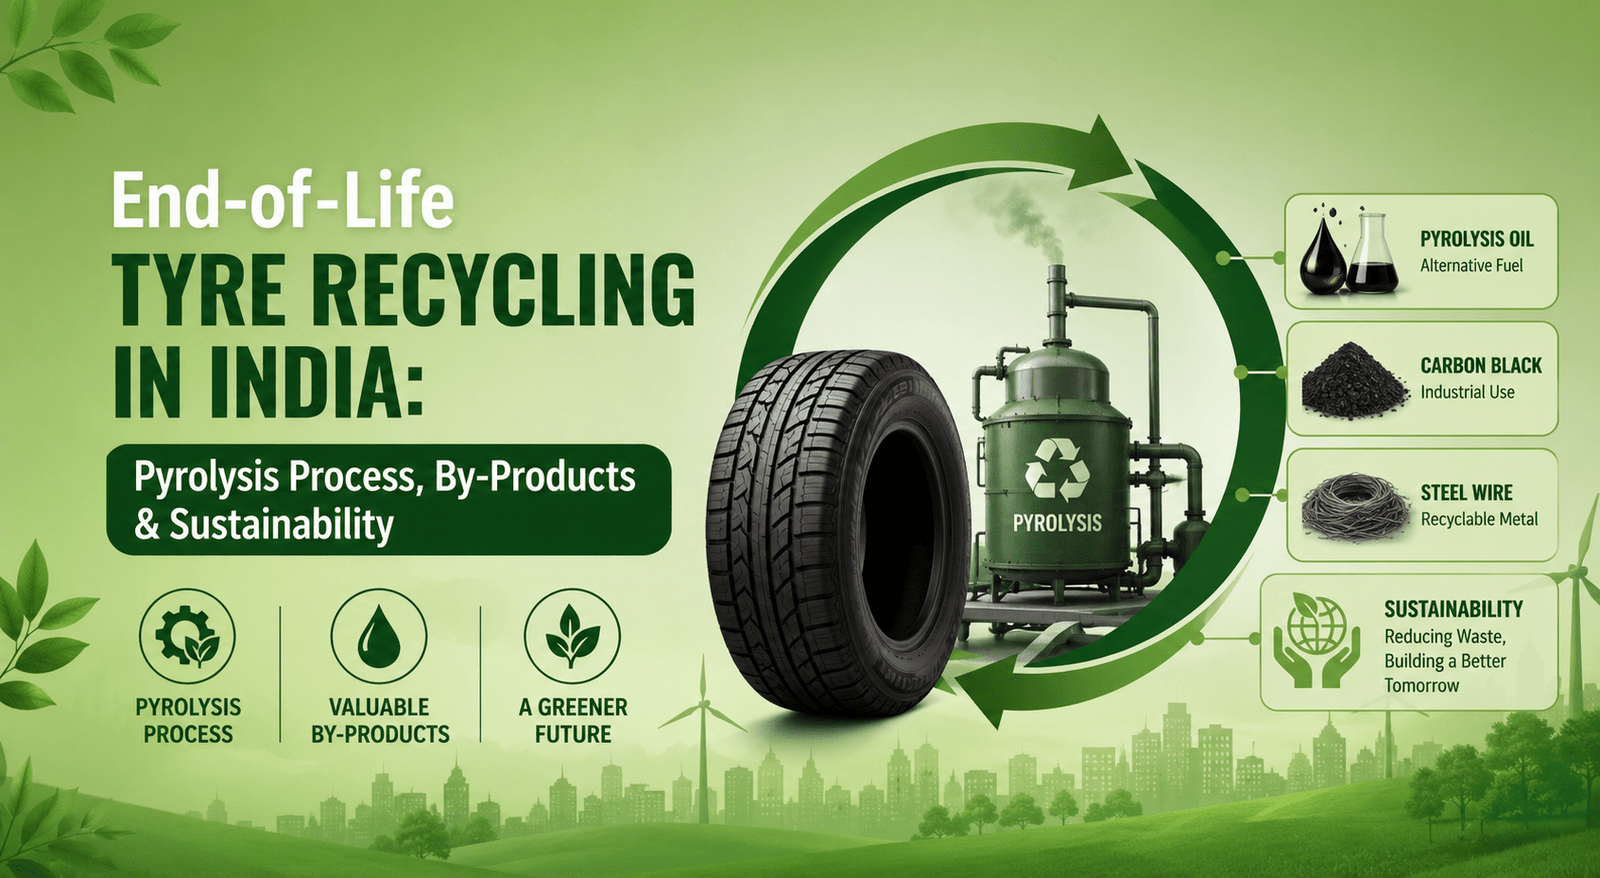
Recovered carbon black (rCB) offers an alternative. It’s made by recycling end-of-life tires through pyrolysis, a process that uses lower temperatures than the traditional furnace method. Because it’s made from waste material instead of new petroleum, its production footprint looks very different.
How Much CO2 Does Virgin Carbon Black Production Create?
Life cycle assessment studies give us a clear starting point. Producing virgin carbon black is energy-intensive, with studies estimating roughly 2.77 kg of CO2-equivalent emissions for every kilogram of virgin carbon black produced. Other industry sources estimate the range slightly higher, at around 2.5 to 3 tonnes of CO2 for every tonne of virgin carbon black, which works out to a similar 2.5–3 kg of CO2 per kilogram.
These emissions come primarily from the furnace process itself, which requires sustained high heat generated by burning fossil fuel feedstocks.
How Much CO2 Does Recovered Carbon Black Production Create?
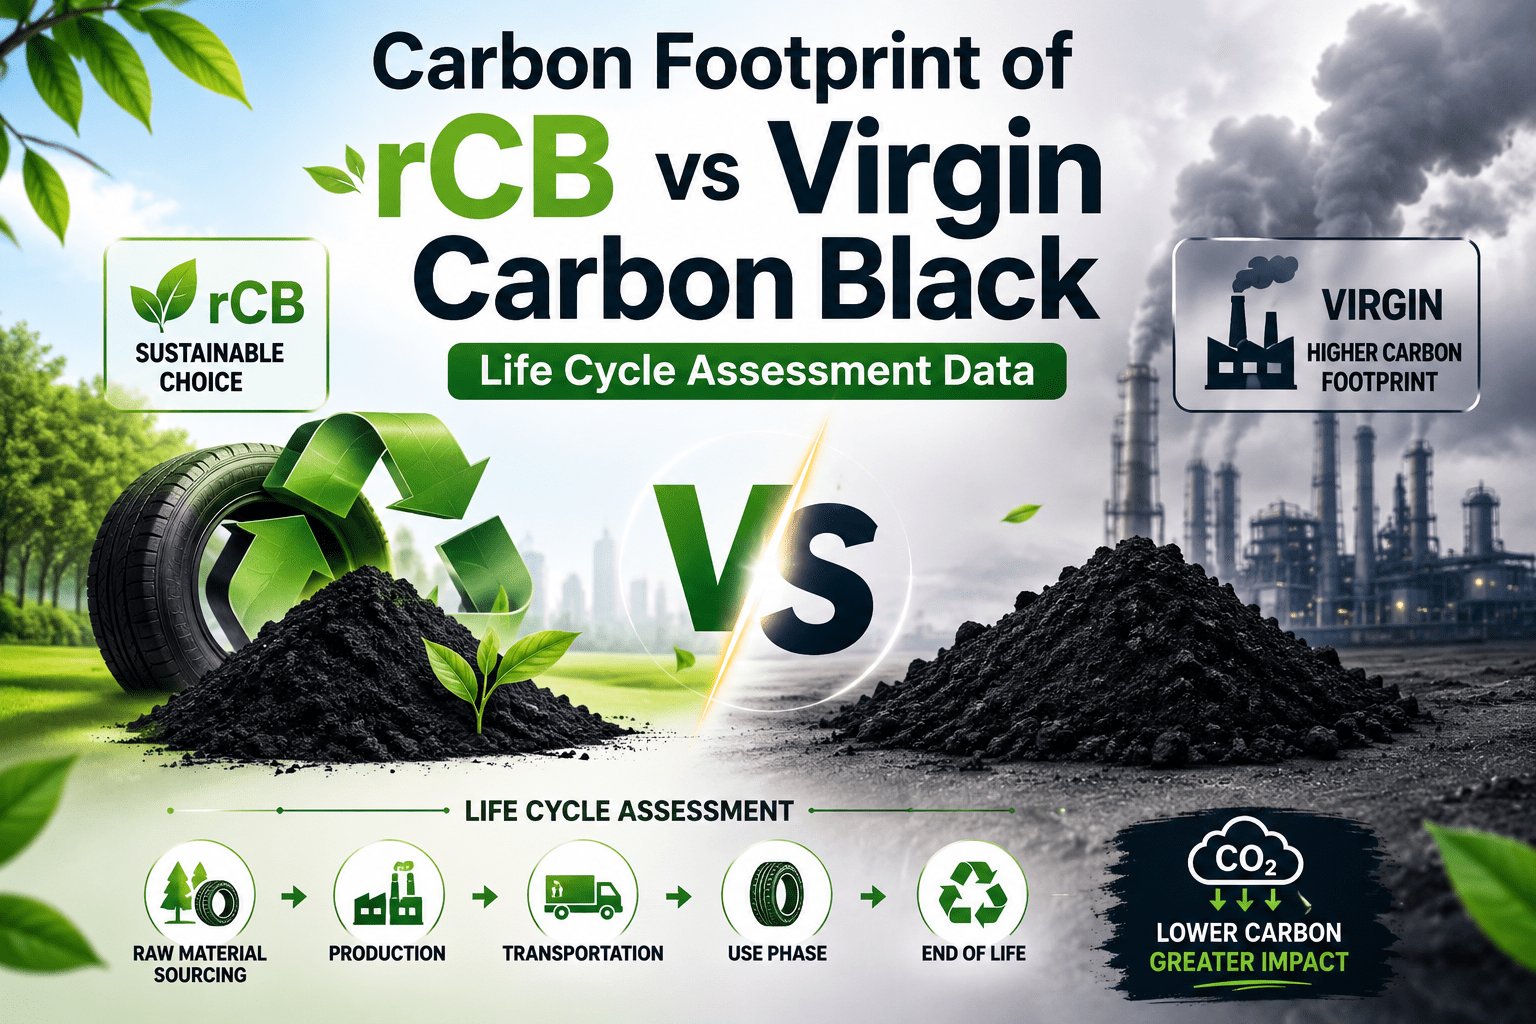
This is where the comparison gets interesting. A life cycle assessment conducted by the IVL Swedish Environmental Research Institute found that producing rCB results in a 79-84% reduction in CO2 emissions compared to virgin carbon black production. In practical terms, this means that for every kilogram of rCB that replaces virgin carbon black, total emissions are reduced by an estimated 1.43 to 2.00 kg of CO2.
A separate industry comparison puts the gap in even simpler terms: producing carbon black from virgin sources generates about 10 kg of CO2, compared to roughly 2 kg of CO2 for the same amount produced through the recovered process, meaning rCB production generates roughly five times fewer carbon emissions than the conventional fossil-fuel-based method.
Some certified rCB products have reported even larger reductions. One ISCC-certified rCB product has reported emissions reductions of up to 93% compared to virgin carbon black, though actual results will vary depending on the specific production process, feedstock, and certification involved.
Side-by-Side: What the Numbers Tell Us
Here’s how the figures line up when placed next to each other:
| Metric | Virgin Carbon Black (vCB) | Recovered Carbon Black (rCB) |
| CO2-equivalent per kg produced | Approximately 2.5–2.77 kg | Significantly lower, often cited around 0.5–1 kg depending on process |
| Reported emissions reduction vs. vCB | Baseline | 79–84% (IVL study); up to 93% for some certified products |
| CO2 avoided per kg of rCB used as substitute | Not applicable | Approximately 1.43–2.00 kg |
| Production process | High-temperature furnace process (1,200–1,900°C) using petroleum feedstocks | Pyrolysis of end-of-life tires at lower temperatures |
| Feedstock source | Petroleum (oil, natural gas) | Recycled end-of-life tires |
The numbers above come from multiple independent studies and may vary based on production methods, energy sources, and regional factors. Always check the specific LCA methodology behind any number you plan to cite.
Why the Gap Is So Large: Understanding the Process Difference
The size of the emissions gap comes down to two key factors:
Feedstock source. Virgin carbon black starts with new petroleum products that must be extracted, refined, and transported before processing even begins. Recovered carbon black starts with waste tires that already exist and need to be diverted from landfills or stockpiles anyway.
Process temperature and energy use. The traditional furnace process for virgin carbon black requires extremely high and sustained temperatures, which demands a continuous, large energy input. Pyrolysis for rCB operates at lower temperatures, and in some processes, gas produced during pyrolysis can be recycled internally to help supply process heat, further reducing external energy demand.
What This Means for the Tire Industry Specifically
Tires are one of the largest end uses for carbon black, with a typical vehicle tire containing around 30% carbon black by composition. This makes carbon black sourcing decisions a meaningful part of a tire manufacturer’s overall carbon footprint.
There’s also a supply consideration: roughly 1.5 billion tires are discarded globally every year, and in Europe alone, around 95% of the 3.5 million tonnes of passenger end-of-life tires were collected as of 2019. This creates a large, steady stream of feedstock for rCB production, supporting the circular economy model where waste tires become a raw material input rather than a disposal problem.
Important Limitations to Understand
While the carbon footprint advantages of rCB are well documented, there are a few important caveats worth understanding before using these figures in your own sustainability reporting:
Quality constraints limit substitution rates. Due to natural variability in rCB quality compared to virgin carbon black, rCB currently has the potential to replace an estimated 10-20% of virgin carbon black in many applications, rather than serving as a full replacement. This means the total carbon savings for a given product depend on the substitution rate actually achieved.
LCA scope matters. Life cycle assessments can be scoped differently. Some virgin carbon black producers conduct “cradle to gate” assessments, covering everything from raw material extraction to the point the product leaves the factory, following ISO 14040 guidelines. When comparing numbers, make sure you’re comparing studies with similar scopes, or the comparison may not be apples-to-apples.
Numbers vary by source and study. Earlier estimates of CO2 reduction from rCB were around 60%, while more recent life cycle assessments found a higher reduction of 79-84%. This shows that methodology improvements and updated data can shift these figures over time, so it’s worth checking the publication date of any LCA you’re referencing.
How to Use This Data in Your Own Reporting
If you’re considering rCB for sustainability goals, here’s a practical approach:
- Request the specific LCA behind your supplier’s claims. Ask whether it follows ISO 14040/14044 guidelines and what the system boundaries (cradle-to-gate vs. cradle-to-grave) are.
- Apply realistic substitution rates. Don’t assume 100% replacement of virgin carbon black; factor in the 10-20% substitution rates that are realistic for most current applications.
- Look for third-party certification. Certifications like ISCC can add credibility to emissions reduction claims, since they involve independent verification of the supply chain.
- Track your own before-and-after numbers. If you switch a portion of your carbon black supply to rCB, measure your actual emissions change rather than relying solely on industry averages.
Final Thoughts
The data is consistent across multiple independent studies: recovered carbon black has a meaningfully smaller carbon footprint than virgin carbon black, with reductions commonly cited in the range of 79-84%, and CO2 savings of roughly 1.43-2.00 kg for every kilogram of rCB used as a substitute. For industries like tire manufacturing, where carbon black is a major input, shifting even a portion of supply toward rCB can represent a meaningful step toward lower emissions, provided the quality and substitution constraints are well understood and properly documented.
This article summarizes publicly available life cycle assessment data for general informational purposes. Figures vary by study, methodology, and production process. Always verify current data with your supplier’s certified LCA documentation before using these figures in formal sustainability reporting.